On High-Range Test Construction 17: Bob Williams, High Range IQ Tests – Are They Psychometrically Sound?

Publisher: In-Sight Publishing
Publisher Founding: March 1, 2014
Web Domain: http://www.in-sightpublishing.com
Location: Fort Langley, Township of Langley, British Columbia, Canada
Journal: In-Sight: Independent Interview-Based Journal
Journal Founding: August 2, 2012
Frequency: Three (3) Times Per Year
Review Status: Non-Peer-Reviewed
Access: Electronic/Digital & Open Access
Fees: None (Free)
Volume Numbering: 12
Issue Numbering: 3
Section: E
Theme Type: Idea
Theme Premise: “Outliers and Outsiders”
Theme Part: 31
Formal Sub-Theme: High-Range Test Construction
Individual Publication Date: August 22, 2024
Issue Publication Date: September 1, 2024
Author(s): Bob Williams
Author(s) Bio: Bob Williams is a Member of the Triple Nine Society, Mensa International, and the International Society for Philosophical Enquiry.
Word Count: 5,930
Image Credits: National Cancer Institute on Unsplash.
International Standard Serial Number (ISSN): 2369-6885
*Original publications here, February, 2021.*
*Please see the footnotes, bibliography, and citations, after the publication.*
Keywords: Cognitive abilities, Experimental tests, External validity, Fuzzy science, High range IQ tests, Hobby tests, IQ measurement, Norming methods, Predictive validity, Psychometric soundness, SLODR (Spearman’s Law of Diminishing Returns), Test design, Test invariance, Validity of self-report.
On High-Range Test Construction 17: Bob Williams, High Range IQ Tests – Are They Psychometrically Sound?
Preface: This manuscript [written in September 2020 - Ed. Note] is intended as a reply to questions relating to two articles in the journal Noesis (Mega Society journal). The questions to me were to simply ask for my thoughts on a couple of journal articles relating to tests that purport to measure IQ at ranges above those considered by professional IQ tests. I decided to render the “long” answer that is found below. I tried to cover the things that I have considered (over a period of years) relative to such tests. The answer has not been scrubbed for appearance or even the order of comments. These are simply my thoughts, with some mention of the various sources that have influenced my thinking about this category of tests.
Tests that claim IQ measurements at very high levels go by a number of names. I have traditionally called them hobby tests, because they are not designed by professionals and marketed by the companies that are dedicated to test instruments. These tests are also sometimes called high end tests, high range tests, power tests, and experimentaltests. I have selected the last of these, as I think there is little inference associated with that terminology.
After some thought, I have decided to put my conclusions before the body text. I don’t want anyone to be led to believe that I hold positions that might be implied, but incorrect.
Conclusions
- There are obviously people who have cognitive abilities that are above the ceilings of professional tests.
- Difficult tests can identify individuals who have very high intelligence. I doubt that anyone would argue that the Putnam Competition does not identify such people. In fact, it may be one of the very best detection vehicles available, despite its necessity for mathematics understanding. The obvious problems are that it works forsome, but not for others and it is not scaled to report IQ.
- People with very high ability may be missed by a typical experimental test, for reasons of test item weighting that impacts broad abilities.
- The rarity of people at IQ levels, above those of professional test ceilings, is the very thing that is the primary obstacle to creating a credible measurement in that range.
- Scores above the ceilings of professional IQ tests are not convincing (not even close). Test designers do not know how to properly connect the scores to reliable reference points and they do not know what we should be measuring in high ranges (see my discussion of SLODR). [SLODR = Spearman’s Law of DiminishingReturns - Ed. Note]
High Range IQ Tests - Are they psychometrically sound?
Professional IQ tests (PT) are typically normed over ranges of ± 2.5 SD. A few go as high as + 3 and fewer still to + 4. Various tests have extended scoring ranges that are basically extrapolations. Hobby test designers have produced “high range” or “experimental” tests that claim very high ceilings. Many such tests are available on the internet and seem to be as popular as video games among some youngsters. These tests raise a number of topics and issues:
- Understanding fuzzy science.
- Is the norming method used valid?
- Do these tests show both internal and external validity?
- Is the self-report “feature” of norming valid?
- Are the tests consistent with the expected design features of professional tests?
- What should be measured? Psychometric g, or group factors? SLODR is the issue.
- Is the test invariant with respect to the most salient groups?
- Very long time limits versus long time limits.
- Have factor loadings been balanced?
- Measuring basic cognitive abilities, versus complex problem solving.
- Have the statistical considerations been examined by a real expert?
- Alternatives to meet the needs of exclusive clubs.
Understanding fuzzy science.
The whole discipline of cognitive science falls well outside of hard science (physics and chemistry and relatedstudies) and becomes a mixture of hard science tools (brain imaging and DNA analysis) and fuzzy science applications. We already know this, but for review, we are measuring intelligence, using an equal interval scale that isproduced, by manipulation, from an ordinal scale and then centered on an average of a small group of people that can vary from test to test, by calendar date, and between nations.
The impressive thing is that, after all of these imprecise maneuvers, we actually can get test results that can be shown to be meaningful and predictive of life outcomes. We must not lose sight of the fact that our measurementtechniques are a set of really fuzzy methods and are not in the category of measuring something with an interferometer or micrometer. Even in hard sciences, the instruments used tend to be accurate over a limited range and either stop or become distorted beyond those ranges, so people don’t make claims that a measurement is accurate when they know their peers are quite aware of what the instruments can deliver.
In the case of experimental tests we are operating in a range where the instruments in question have not been well-calibrated and are not used by professionals and are even probing into areas where the things being measured may be different from what is found over more than 99% of the range of the parameters. [One-in-100 IQ ~135 and one-in-1,000 IQ ~147 -Ed. Note]
Is the norming method used valid?
Various experimental tests designers presumably use different methods of linking scores to what they believe are meaningful IQs. I cannot claim to have seen or evaluated these approaches, but I doubt that they generally conform to the methods used by PT designers. Assuming Classical Test Theory (more about that later), the designers effectively force fit a Gaussian distribution to the results of tests given to the norming group. This means that the test is dependent on the norming group being large enough and representative of the group the test is intended to serve. The force fitting is done by adding and subtracting test items with difficulty levels that will increase or decrease the number of correct answers at the points on the distribution which do not fit the normal curve.
If the test author simply selects a group of test items and uses the whole lot, he is not likely to end up with a good fit.He needs to start with extra test items and select only those that produce a good fit to the Gaussian distribution.
Here we again meet fuzzy issues. For starters, we have no idea how IQ is distributed beyond the ceilings of well designed, comprehensive PTs. The experimental test designer knows that he is not dealing with a full range of data,so he is trying to fit to the right tail, not really knowing where he is on the tail, nor its real world shape.
At this point, we should go to chapter 4 of A.R. Jensen’s Bias in Mental Testing (1980). New York: Free Press. It is a discussion of why it is reasonable to assume a Gaussian distribution. Jensen makes the point that the distribution is indeed normal over the ranges of PTs and does so in thousands of words. One illustration goes back to my comments about the fuzzy nature of what we are doing:
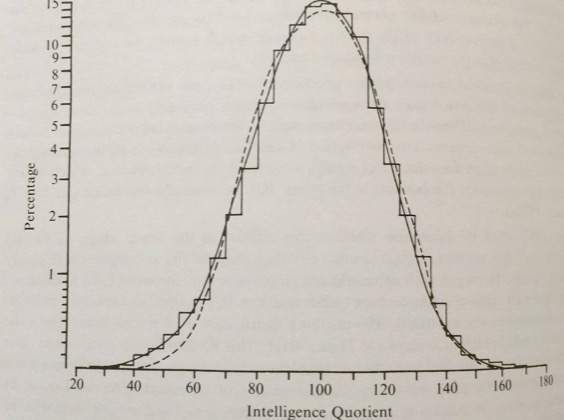
Figure 4N.1. (above) Distribution of Stanford-Binet [S-B]IQs of a sample of 4,523 London children from which all cases of diagnosed brain damage and extreme environmental deprivation have been excluded. A normal curve (dashed line) and Pearson’s Type IV curve (continuous line) are superimposed on the actual data (stepwise curve). Note that the Type IV curve shows a closer fit to the data than does the normal curve. (From Burt, 1963, p. 180) [Jensen, Bias in Mental Testing, page 120 -Ed. Note]
First, note that the S-B results in the figure (reasonably large N) are a closer fit to a Type IV curve than a normal curve. We use the Gaussian distribution because it works well enough, given the fuzzy nature of otherconsiderations;; because it simply doesn’t matter (look at the two fit options);; and because Mother Nature generallydoes things that fit a normal distribution. Here is what Jensen [on page 88 of The g Factor -Ed. Note] wrote about the fit:
There are plausible reasons, however, for assuming that individual differences in g have an approximately normal, orGaussian (“bell-shaped”), distribution, at least within the range of ± 2 𝜎 from the mean. That range is equivalent to IQs from 70 to 130 on the typical IQ scale (i.e., μ = 100, 𝜎 = 15). Individual differences in general mental ability are usuallymeasured by some test or combination of tests that are highly g loaded, and such tests are purposely constructed to have an approximately normal or bell-shaped distribution in the standardization population. Although the normal distribution of test scores is usually accomplished by means of certain psychometric artifices, it has a quite defensible rationale.
Covering a range of ± 2 is a much more reasonable claim for the fit than trying to extend it by several additionalstandard deviations. We use the curve over a limited range because it works, not because it is the direct cause of intelligence over any range. My point here is to again point out that we are in a fuzzy world, not dealing with hard science.
Do these tests show both internal and external validity?
When a PT is produced, it is evaluated against a wide range of statistical measures that indicate whether the test does what it is supposed to do. First, is internal (construct) validity, which simply means: does the test measure the thing it claims to measure. The methods used to establish construct validity are messy, compared to some others and are discussed in Bias in Mental Testing [e.g., pages 303-305 -Ed. Note]. The test can be factor analyzed and compared to the factor analysis of an accepted standard test (Wechsler, etc.) and can be otherwise directly compared to tests that have historically produced consistent results.
Caption for image (below): Accomplishments across individual differences within the top 1% of mathematical reasoning ability 25+ years after identification at age 13. Participants from Study of Mathematically Precocious Youth (SMPY) Cohorts 1, 2, and 3 (N = 2, 385) are separated into quartiles based on their age - 13 SAT-M score. The quartiles are plotted along the x-axis by their meanSAT-M score. The cutoff for a score in the top 1% of cognitive ability was 390, and the maximum possible score was 800. Oddsratios (OR) comparing the odds of each outcome in the top (Q4) and bottom (Q1) SAT-M quartiles are displayed at the end of every respective criterion line. An asterisk indicates that the odds of the outcome in Q4 was significantly greater than Q1. STEM = science, technology, engineering, or mathematics. STEM Tenure (Top 50) = tenure in a STEM field at a U.S. university ranked in the top 50 by U.S. News and World Report’s “America’s Best Colleges 2007.” Adapted in part from Park, Lubinski, and Benbow (2007, 2008).
The real issue is external (predictive) validity. This is the heart and soul of any IQ test. If the test does not predict real world outcomes that are independent of the test, there is no practical use for the test. Readers here already know the factors that are most strongly correlated with IQ, so there is no need to explain what needs to be checked. In the case of this discussion, we are concerned with experimental tests and whether they are or are not valid. I submit that the acid test is external validity. If we go to the high end of the spectrum (our reason for this discussion) we have an excellent demonstration of the predictive validity of intelligence for the SMPY cohorts.
The question that must be convincingly asked of experimental tests designers is whether they can show similarexternal data, verifying that there are differences in such things as educational achievement, income, publications, etc. that are predicted (presumably increasing) by the IQ scores these tests report above the ceilings of PTs. If the answer is NO, what is the reason for the tests? This is the meat and potatoes of IQ testing. Predictions must be verifiable.
Is the self-report “feature” of norming valid?
Among the fuzzy aspects of attempting to design a measurement tool for high IQ is the use of self-reports. I seeseveral concerns with such data playing a vital role in norming. If the self- reports are from different tests (as one wouldassume to be the case), even flawless self-reports are from tests that share a relatively small amount of variance. The data below are old, but indicate typical test-A to test-B correlations:
- WAIS to Stanford Binet = 0.77
- WAIS to Raven’s = 0.72
- WAIS to Otis = 0.78
- WAIS to SAT = 0.80
Seligman, D. (1994) A Question of Intelligence: The IQ Debate in America. New York City. Carol Publishing Group. (Page 167)
The first comparison is a 59% shared variance. But we all know that self-reports have a degree of error. Although it is not a direct comparison, when people are asked to estimate their IQ, the result is a staggering overstatement of 30 IQpoints! (I understand that self-estimate and self- reporting are different. But I think this observation is worth keeping in mind.)
(Gilles E. Gignac, Marcin Zajenkowski, People tend to overestimate their romantic partner’s intelligence even more than their own, Intelligence, Volume 73, 2019, Pages 41-51.)
The issue of self-reports has been studied extensively, with results somewhat dependent on the nature of the information being reported. Here is a reasonable comment on the general topic:
Cook and Campbell (1979) have pointed out that subjects (a) tend to report what they believe the researcher expects to see, or (b) report what reflects positively on their own abilities, knowledge, beliefs, or opinions. Another concern about such data centers on whether subjects are able to accurately recall past behaviors. Cognitive psychologists have warned that thehuman memory is fallible (Schacter, 1999) and thus the reliability of self-reported data is tenuous.
Source: Chong-ho Yu (2013) Reliability of self-report data.
It is understandable that a designer would want to use self-reported test scores in an attempt to link his test to a PT, but the number of error sources is obviously large – to the point of making such an effort seem futile.
Are the tests consistent with the expected design features of professional tests?
For any comprehensive IQ test to function properly it must have test items of different levels of difficulty. I am unaware of the methods used by experimental test designers, but if they do not have a reliable means of determining relative difficulty, they are shooting in the dark.
From chapter 4 of Bias in Mental Testing:
“The simple fact is that a test unavoidably yields a near normal distribution when it is made up of (1) a large number of items, (2) a wide range of item difficulties, (3) no marked gaps in item difficulties, (4) a variety ofcontent or forms, and (5) items that have a significant correlation with the sum of all other item scores, so as to ensure that each item in the test measures whatever the test as a whole measures. (Items that are uncorrelated or negativelycorrelated with the total score can only add error to the total scores.) These are all desirable features of a test.”
In the case of experimental tests, my impression is that these things pose problems. Is the number of items highenough when the test is intended to be very difficult and worked on for weeks?
Does the designer know the item difficulty of each item? If he does not know, how does he conclude that he has not created large gaps in difficulty or bunched many test items together because they have the same item level difficulty?
Are the items sufficiently diverse with respect to Jensen’s 4th condition (content variety)? In constructing a comprehensive IQ test, professional designers repeatedly note that the test must be diverse. Here is what differentiates PTs of different quality:
Poor = 1 Fair =2 Good = 3 Excellent = 4
| 1. Number of tests | 1 | 1-2 | 2-8 | 9+ |
| 2. Dimensions | 1 | 1-2 | 2-3 | 3+ |
| 3. Testing time | 3-9 min | 10-19 min | 20-39 min | 40+ min |
| 4. Correlations to g | ≤ .49 | .50-.71 | .72-.94 | ≥ .95 |
Source: Gilles E. Gignac, Timothy C. Bates (2017) “Brain volume and intelligence: The moderating role of intelligence measurement quality”;; Intelligence 64, 18–29.
Clearly, the number of tests (subtests) needs to be 9 or more in order to produce at least three second order factors,from which g can be extracted. Do experimental tests really use that many subtests? In my opinion, the number of dimensions should be higher for a comprehensive test.
The real problem here is that we are measuring in the range in which we have no way to know what is happening to g,other than it is likely that SLODR is a serious consideration and that the g variance is no longer a linear indicator of intelligence.
When an experimental test is used, the designer may have to deal with some difficulty in calculating the reliability coefficient. It is simply the ratio of the variance in the true test score, divided by the error variance. The methods used to calculate the reliability coefficient are typically to effectively administer the test twice (by designing an almost identical test, with test items of equal levels of difficulty) or by using the split-half method (correlating the two halves, then applying the result to the Spearman-Brown formula. If the number of test scores available is small, the process is difficult. I have not seen any indication that designers have used double testing of the same group, which leaves only the split-half method. Hopefully there is data showing that this methodwas properly applied to each experimental test and that the results show a coefficient close to 0.90.
Most IQ tests have historically been designed to be scored using Classical Test Theory. But, since the development of Item Response Theory [IRT -Ed. Note], we have a clearly superior method that is based on known item level difficulty.IRT still requires that the test items be given to a reference group, which matches the characteristics of the full population of the group to be represented by the finished test. The developer determines an Item Characteristic Curve for each test item and can then determine IQ based on the item difficulty of the most difficult items that have correct responses from the testee. This method is particularly well suited to use in computer testing, since the computer canpresent more or less difficult test items in response to correct or incorrect responses. In the case of experimental tests the number of test items may be too small for IRT to be practically applied, but if it were used, at least the designer could avoid using test items that are too close to the same level of difficulty and space the items, such that there are not large gaps in the levels of difficulty. If item level difficulty is not known, it is difficult to believe that anything other than luck would make the test perform properly – particularly over a very high intelligence range.
What should be measured? Psychometric g, or group factors? SLODR is the issue.
IQ tests measure g, non-g residuals of broad abilities, and uniqueness. The sum of the variances of these must equal 100%. Over most of the IQ spectrum (let’s think in terms of ± 2 SD for discussion), the thing we are looking for(outside of clinical applications) is g, because it accounts for virtually all of the predictive validity of the test. We usethe IQ test as a proxy for g because there is usually enough g saturation to justify the proxy.
When high levels of intelligence are involved, there is the possibility that g is not following a linear increase with the measurement from the test in question. This is Spearman’s Law of Diminishing Returns (SLODR). Jensen wrote (seeAppendix A - The g Factor): “The higher a person’s level of g, the less important it becomes in the variety of abilities the person possesses.”
Evans explained the situation well: “The possibility of a breakdown of g at higher levels of intelligence, even with a narrow range of tests (as in the Armed Services Vocational Aptitude Battery) implies that we may have to reexamine the nature of intelligence.” … “There may be a single driving factor at low levels of g, but this may be manifested in a variety of different ways at high levels of g.” (Evans, M. G. (1999). “On the asymmetry of g,” Joseph L. Rotman Schoolof Management, University of Toronto.)
A clean proof of exactly what is happening is difficult. There has been about one paper addressing this at most ISIR conferences over the past decade or more. In 2004, I asked Jensen if it would be possible to calculate g in relatively narrow slices to prove the effect. He confidently replied that comparing the top and bottom halves (which had already been done) was about the best that could be done. The various papers I mentioned have approached the problem from different directions with mixed results. My impression is that the weight of evidence is that Spearman was right and SLODR is real. Unfortunately, that does not tell us if it is a small, moderate, or large effect, nor does ittell us how much the effect size might change at very high levels.
In a qualitative sense, we see that bright people seem to obviously demonstrate that there are increasing differencesin their areas of highest performance. Jensen discusses this qualitative observation in various places, including the Appendix A, mentioned above.
When a test seeks to measure at very high levels, it is dealing with intelligence that is not structurally the same as that found at lower levels and which seems to become particularly characterized by non-g factors. Do experimental teststake this into account? If they claim to do equally well as a PT below the usual ceilings, what suggests that they also do well when the nature of intelligence is different?
Let’s consider a test-A that consists of mostly verbal test items and another, test-B, that consists of many spatial items.If we are attempting to measure IQ at very high levels, it is very likely that a person who scores well on test-A will notscore well on test-B (or vice versa). How do we rationally compare someone with high and narrow verbal ability to someone with high and narrow spatial ability? Isn’t this similar to comparing the abilities of a superb painter to those ofa world class mathematician? My perspective is that when SLODR kicks in the utility of IQ tests is damaged because we rely on a linear g throughout the major range of interest, then we try to use the same measurement approaches when intelligence biologically changes. It is much like studying a solid and understanding its thermal expansion until the temperature causes the solid to start melting.
Is the test invariant with respect to the most salient groups?
PTs are typically evaluated to show that they are invariant relative to race, sex, and occasionally other groups (age is a special case). If the tests are designed around data that is skewed toward a racial or ethnic group, is the test valid for other groups? If invariance is not shown, there should be a cautionary flag that the test is only for specific listed groups. Invariance is typically shown by multiple group confirmatory factor analysis. If invariance is not established, for race/ethnicity (example), the interpretation of the results of testing a group may have an embedded error of unknown magnitude. Does the test only work for one sex, or has invariance by sex been confirmed?
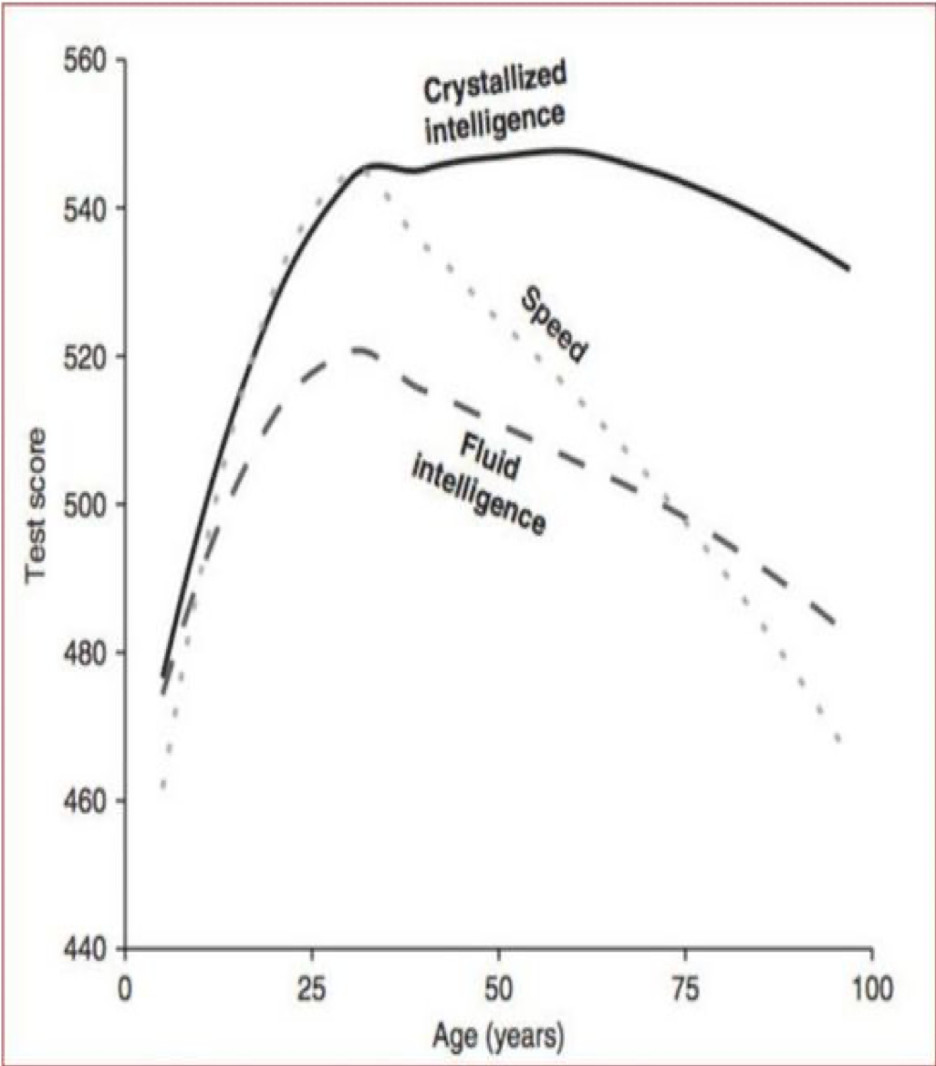
In the case of age, there are several considerations. Does the scoring determine z-scores by age groups, or are theyall taken as the same? (Age adjustment is a necessary requirement for a professional IQ test, unless the test specification is limited to a narrow age range. IQ is as defined by David Wechsler’s method and is relative to age peers.) We know that the brain is constantly changing from birth to death. One of the things that we accept as a given is that IQ measurements are relative to age peers. The figure below relates directly to this concern.
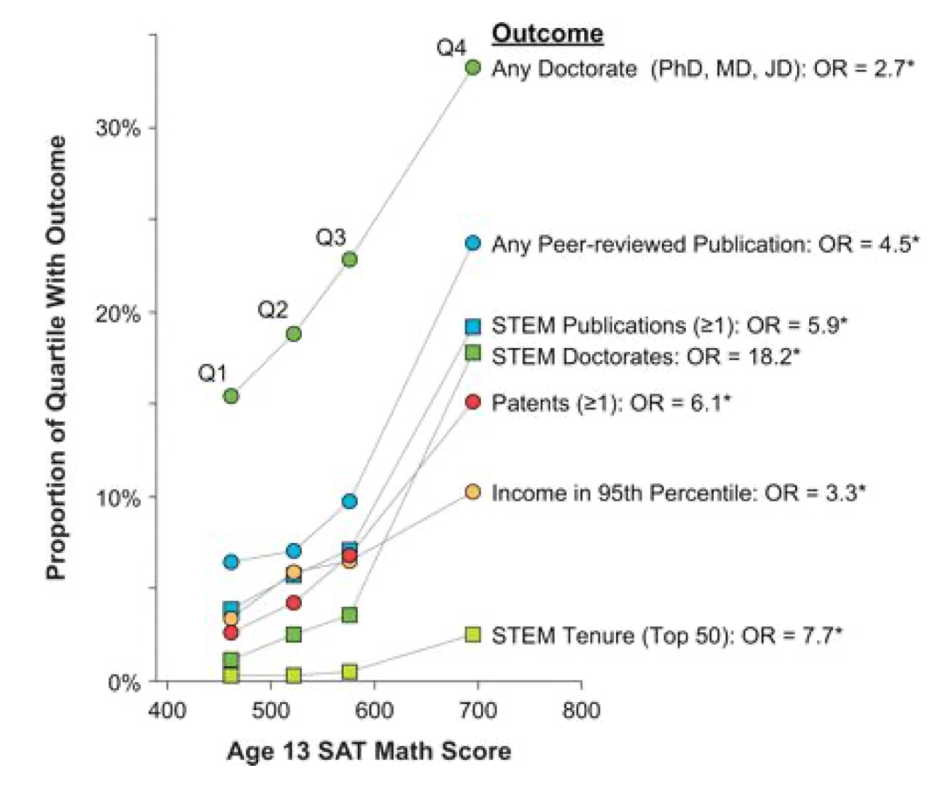
Figure source: Intelligence: All That Matters, S.J. Ritchie, John Murray Learning, London (2015).
It is vital that age effects are taken into account or the test will not reflect the thing we understand as IQ. The differences between age 30 and age 50 are large. Naturally invariance must be established for age. If it is not, the test should specify the age range over which it is known to be invariant.
Establishing sex invariance could be even more challenging than simply finding an appropriate norming group. The combined factors of a higher male mean IQ (age 16 and above) and the higher male SD results in a huge difference of males and females at high levels of intelligence. For example, data for whites:

Figure source: Sex differences across different racial ability levels: Theories of origin and societal consequences;; Helmuth Nyborg;; Intelligence 52 (2015) 44–62.
The sex ratio at IQ 145 is already 7 males per 1 female and is increasing rapidly. Interestingly, the ratio is higher for Hispanics and higher still for blacks.
Very long time limits versus long time limits.
Let’s forget SLODR now and look at other features, as used in PTs. Many of the test items that are used in PTs can be given without time limits. It is well established that removing time limits does not reduce the reliability of these items, nor does the use of adequately long time limits. The problem that arises is that tests without time limits that are actually expected to take weeks to complete cannot measure any of the factors associated with time. Mental speed accounts for up to 80% of the variance in intelligence (there is a lot of covariance, particularly with WMC). [WorkingMemory Capacity = “The capacity to selectively maintain and manipulate goal-relevant information without getting distracted by irrelevant information over short intervals.”
Source: https://www.sciencedirect.com/topics/psychology/working-memory-capacity -Ed. Note]
Giving up this whole category of measures significantly reduces the subtests that can be used.
It gets worse…Working Memory Capacity (WMC) also accounts for up to 80% of the score variance (obviously thismeans a lot of covariance with mental speed). The literature is stacked with studies showing very high relationships between WMC and various parameters related to intelligence (g, Gf, executive function, attention, inhibition, etc.). While it may be argued that these are indirectly measured by very difficult test items, skipping the step of direct measurement seems to be a detriment to the strength of a high quality test. The simple fact is that WM measurements are time dependent.
(There is an indirect speed effect, in other measures, due to the Gs correlation with Gf and WMC.)
[https://en.wikipedia.org/wiki/Cattell%E2%80%93Horn%E2%80%93Carroll_theory -Ed. Note]
Have factor loadings been balanced?
The g loading of a subtest is somewhat dependent on the structure of the other parts of the test. Over or under representation of factors being tested directly influences the other test items. For this reason PTs seek a balancebetween the numbers of test items in a given test category. Can we depend on the experimental tests to be balancedin its structure? If not, one might argue that Spearman’s indifference of the indicator works in favor of the narrow test (RPM is an example), but this is the very point that differentiates a high quality test from a lesser one (see the previous figure from Gignac and Bates). The problem is that experimental tests show deficiencies in many areas that are important to PTs.
[RPM = Raven’s Progressive Matrices, “a nonverbal test typically used to measure general human intelligence and abstract reasoning” thereby gauging fluid intelligence.
Cf. https://en.wikipedia.org/wiki/Raven%27s_Progressive_Matrices -Ed. Note]
Measuring basic cognitive abilities, versus complex problem solving
When I looked in Intelligence to see how many papers were about complex problem solving, I found that the numberis very high (so high I don’t believe it). Of the papers I have read, I have generally been impressed that they show littledifference between testing people with complex problems and testing them with a comprehensive test, such as the WAIS or Woodcock-Johnson.
I previously mentioned SLODR, but I would point out that there are also diminishing returns in testing. As JamesThompson has pointed out in at least 3 articles on The Unz Review, there are some very quick (as in 2 minutes or less) tests that do quite well when correlated with high quality PTs. This is a wonderful example of diminishing returns. As the test used is improved with more test items, more factors, longer testing time, etc. there are gains in reliability, and presumably various things such as internal and external validity, ceiling, floor, and g loading, but these come in ever-decreasing increments. I am trying to illustrate that an experimental test is attempting to make a large move in the direction of ceiling and that achieving such a change should come at a very high cost.
It is my general impression that experimental tests are intended to probe some traditional second order factors by using test items that have high difficulty. To the extent that these are multi-step solutions, they probably can be fairly classified as complex problem solving test items. In that case, there is a huge amount of literature to evaluate, if the designer is concerned about changing the nature of IQ testing to CPS [complex problem solving -Ed. note] format. It may be justifiable, but should be understood by the designer, in terms of how it actually impacts test results and theirrelation to standard PTs. For example, Alexander Christ, et al. (Intelligence 78 (2020) 101421) noted that complexproblem solving and reasoning have proved to be distinct constructs.
Have the statistical considerations been examined by a real expert?
The question above is self explanatory. For example, has the author of the experimental tests designed conventionaltests that are in use by clinical psychologists, intelligence researchers, and which are referenced in the major textbooks on this subject? If not, it would seem to be helpful to have a person with such a background evaluate the test in the various categories I have mentioned.
I am aware that some experimental test designers are quite intelligent, well educated, and believe themselves to befully competent to design an outstanding IQ test. Those people should, in my opinion, meet the simple standards I listed.
Alternatives to meet the needs of exclusive clubs
The problem that I see with experimental tests is that they purport to actually measure IQ in a range that is beyond the reasonable ceilings of PTs. One option is to not claim that the tests measure IQ and simply give a raw score. Allow clubmembership based on the raw score alone, without attempting to connect the score to IQ.
It may be possible to use tests given in early life (as is done with SMPY), if the rarity of the score can be established. I have doubts that much can be done beyond the published 1 in 10,000 results from the Vanderbilt researchers.
As I see it, a primary problem is that the design of experimental tests is unlikely to ever be done with a full range reference group (from very low to very high). The designers try to invent a way to work on only a piece of the right tail.The problem is that they don’t know how to set the data, such that it actually fits the extreme high end of a Gaussian distribution. I honestly think this problem is not going to be resolved in a convincing way, using existing methods. In his discussion of how to best deal with researching the Flynn Effect, Jensen suggested anchoring test scores to biological measures:
“As I have suggested elsewhere, conventional psychometric raw scores will need to be anchored to measures that presumably are not influenced by the environmental variables that raise test scores without increasing g. The anchor variables would consist of measures of reaction time to various elementary cognitive tasks, evoked brain potentials, nerve conduction velocity, and the like, that are demonstrably g-loaded. (A composite measure based on the anchor variables should have a reasonably high correlation [say, r > .50] with the psychometric test scores.) Mental test raw scores would be regressed on these anchor variables in a representative sample of some population.
…That is, the mean gain would be reflected in the anchor variables as well as in the test scores.”
It might be possible to find biological measures that could be used to anchor a common point between a test such asthe WAIS and an experimental test and then have some confidence that the joint is based on something measurable. Unfortunately, simply finding a common point does not resolve the other issues that strike me as murky, such as theissues associated with SLODR and general test design considerations. The comments directly below may offer more promise.
We live in a rapidly changing world. Only a few years ago, brain imaging was very limited, but when MRI technology was introduced, there was a sudden explosion of living brain data that had not previously been seen. Neurologists are turning out studies faster than anyone can reasonably read them. As far back as 2006, Richard Haier told the ISIR conference that we would be able to measure intelligence entirely from brain imaging and that it was not too far off. I later asked him for more insight on it and he told me that the problem was basically that – in 2007 – it takes one of the few expert researchers to read the data. This makes the cost too high to be practical. Of course, the “reading” will be automated and probably be enhanced by using machine learning. The most likely method will be one that combines many measurable factors (cortical thickness, cortical surface area, size and shape of the corpus callosum, fractional anisotropy of gray and white matter, and measures of the connective networks (such as mean path length and numbers of connections to major and minor hubs). We already have a patent that is limited to CT: Patent US8301223 - Neurobiological method for measuring human intelligence and system for the same.
“The method enables neurometric IQ to be measured by processing MRI and fMRI images of a subject to determine cortical thicknesses and brain activation level, determining structural IQ (sIQ) and functional IQ (fIQ) from the determined cortical thicknesses and brain activation level, and using the structural IQ (sIQ) and the functional IQ (fIQ) as predictors to measure the neurometric IQ of the subject. With this, individual differences in general cognitive ability can be easilyassessed. It suggests that general cognitive ability can be explained by two different neural bases or traits: facilitation of neural circuits and accumulation of crystallized knowledge.”
Imaging technology may eventually create very high ceilings – or not. The obvious problem is that we must wait forthis to be fully developed and automated to the point of reasonable costs. Haier told me that he envisioned a full psychometric evaluation in 20 minutes at a 2007 cost of about $200.
Footnotes
None
Citations
American Medical Association (AMA 11th Edition): Williams B. On High-Range Test Construction 16: Rick Rosner, Editor’s Comments. August 2024; 12(3). http://www.in-sightpublishing.com/high-range-17
American Psychological Association (APA 7th Edition): Williams, B. (2024, August 15). On High-Range Test Construction 16: Rick Rosner, Editor’s Comments. In-Sight Publishing. 12(3).
Brazilian National Standards (ABNT): WILLIAMS, B. On High-Range Test Construction 16: Rick Rosner, Editor’s Comments.In-Sight: Independent Interview-Based Journal, Fort Langley, v. 12, n. 3, 2024.
Chicago/Turabian, Author-Date (17th Edition): Williams, Bob. 2024. “On High-Range Test Construction 16: Rick Rosner, Editor’s Comments.” In-Sight: Independent Interview-Based Journal 12, no. 3 (Summer). http://www.in-sightpublishing.com/high-range-17.
Chicago/Turabian, Notes & Bibliography (17th Edition): Williams, B “On High-Range Test Construction 16: Rick Rosner, Editor’s Comments.” In-Sight: Independent Interview-Based Journal 12, no. 3 (August 2024).http://www.in-sightpublishing.com/high-range-17.
Harvard: Williams, B. (2024) ‘On High-Range Test Construction 16: Rick Rosner, Editor’s Comments’, In-Sight: Independent Interview-Based Journal, 12(3). <http://www.in-sightpublishing.com/high-range-17>.
Harvard (Australian): Williams, B 2024, ‘On High-Range Test Construction 16: Rick Rosner, Editor’s Comments’, In-Sight: Independent Interview-Based Journal, vol. 12, no. 3, <http://www.in-sightpublishing.com/high-range-17>.
Modern Language Association (MLA, 9th Edition): Williams, Bob. “On High-Range Test Construction 16: Rick Rosner, Editor’s Comments.” In-Sight: Independent Interview-Based Journal, vo.12, no. 3, 2024, http://www.in-sightpublishing.com/high-range-17.
Vancouver/ICMJE: Bob W. On High-Range Test Construction 17: Bob Williams, High Range IQ Tests – Are They Psychometrically Sound? [Internet]. 2024 Aug; 12(3). Available from: http://www.in-sightpublishing.com/high-range-17.
License & Copyright
In-Sight Publishing by Scott Douglas Jacobsen is licensed under a Creative Commons Attribution-NonCommercial-NoDerivatives 4.0 International License. ©Scott Douglas Jacobsen and In-Sight Publishing 2012-Present. Unauthorized use or duplication of material without express permission from Scott Douglas Jacobsen strictly prohibited, excerpts and links must use full credit to Scott Douglas Jacobsen and In-Sight Publishing with direction to the original content.

